BMI Calculator
This calculator will help you calculate and evaluate your Body Mass Index (BMI).
As a result, it will indicate whether you fall within the underweight, normal, overweight,
or obese class.
Age :
Height (cms):
Weight (kg) :
According to your inputs,
Here is the result
Result
-
- Healthy BMI range: 18.5 kg/m² – 25 kg/m²
The Body Mass Index (BMI) Calculator helps determine your BMI and related weight category, factoring in your age. You can choose the "cm" tab for SI units or the "ft/in" tab to switch to metric measurements.
BMI introduction
BMI is a measure used to assess a person's body fat based on their height and weight, providing an estimate of overall body mass. It serves as a common tool to gauge whether someone’s weight falls within a healthy range relative to their height. The calculated BMI value helps classify individuals into categories such as underweight, normal weight, overweight, or obese. These categories can vary depending on factors like age and region and may also include more specific subgroups like severely underweight or extremely obese. While BMI isn’t a perfect measure of health, it offers a helpful starting point to identify whether further evaluation or action may be needed. You can refer to the table below to view the classification ranges used by this calculator.
BMI table for adults
This is the World Health Organization's (WHO) recommended body weight based on BMI values for adults. It is used for both men and women, age 20 or older.
| Classification | BMI range - kg/m2 |
|---|---|
| Severe Thinness | < 16 |
| Moderate Thinness | 16 - 17 |
| Mild Thinness | 17 - 18.5 |
| Normal | 18.5 - 25 |
| Overweight | 25 - 30 |
| Obese Class I | 30 - 35 |
| Obese Class II | 35 - 40 |
| Obese Class III | > 40 |
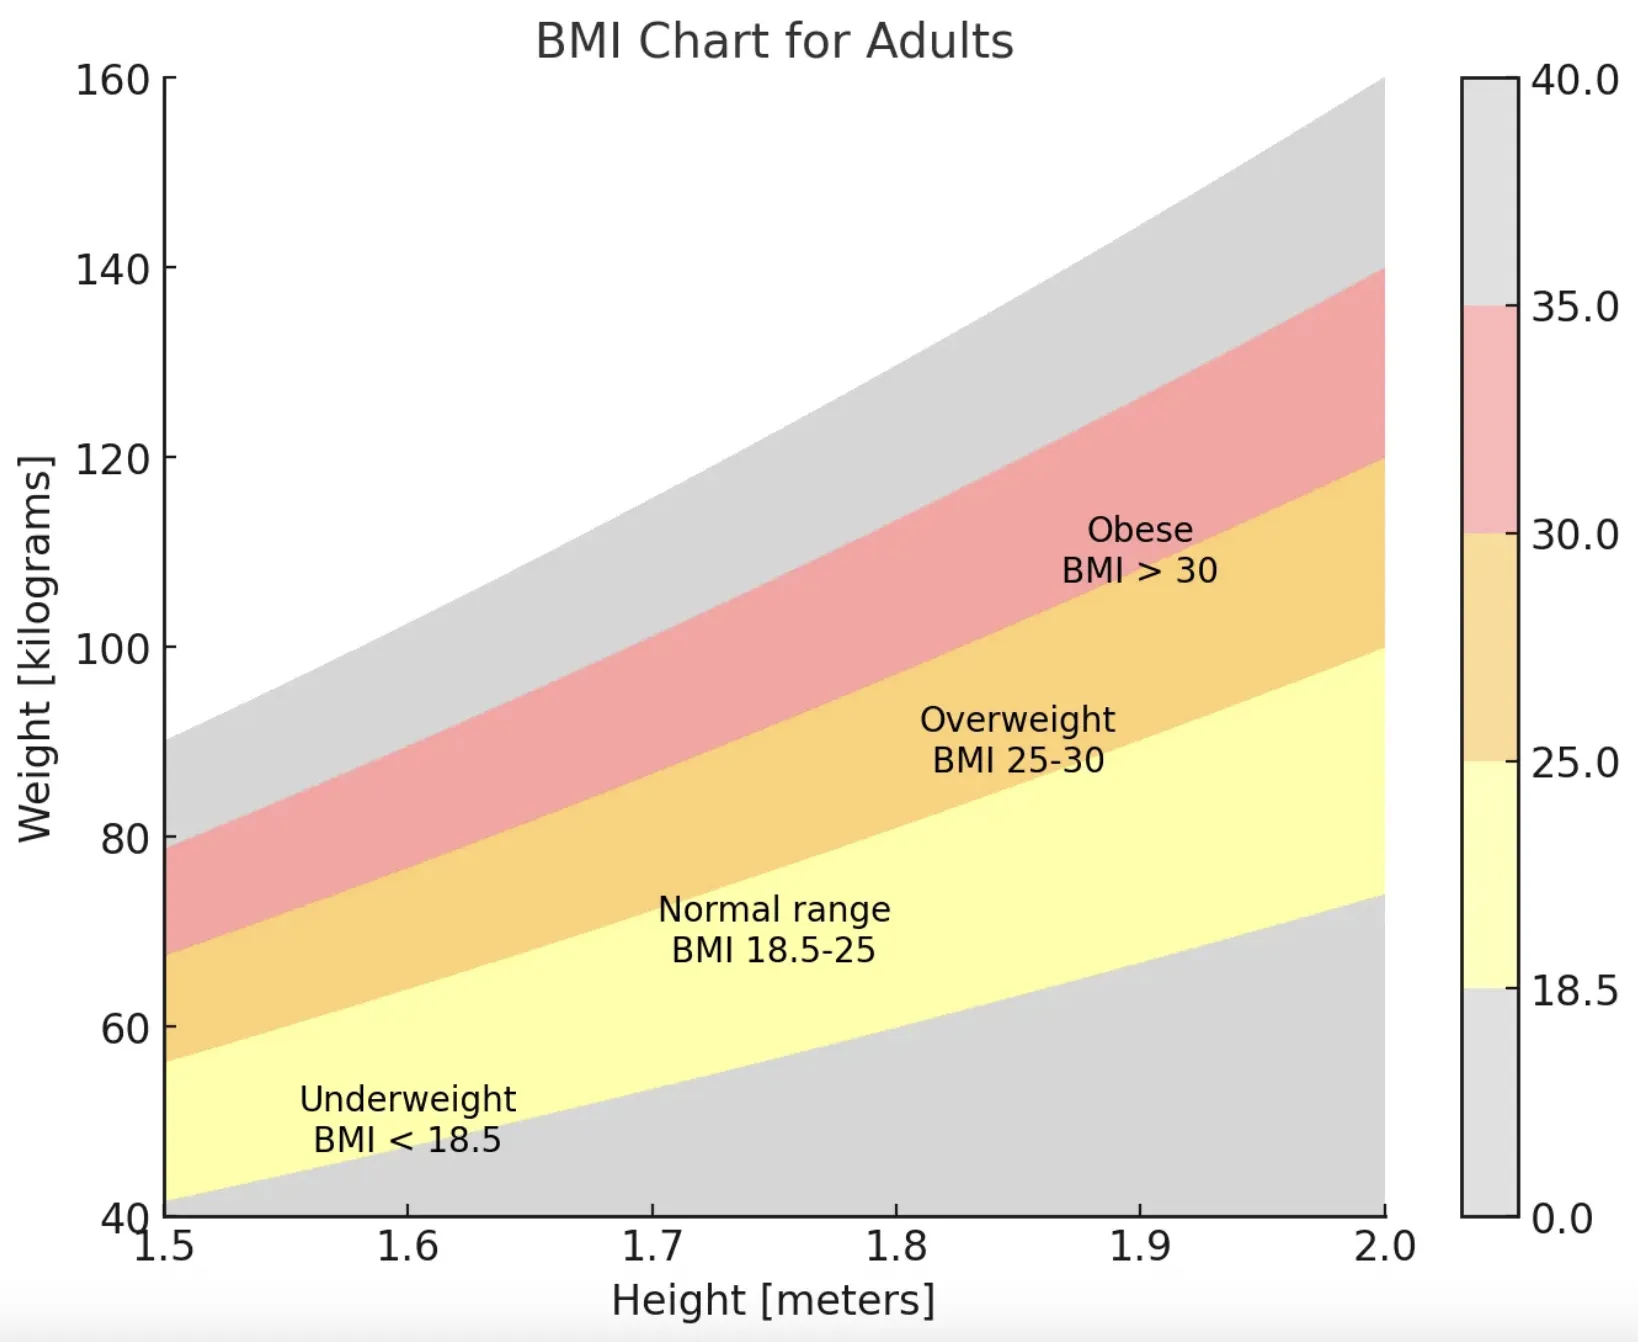
BMI chart for adults
This is a graph of BMI categories based on the World Health Organization data. The dashed lines represent subdivisions within a major categorization.
BMI table for children and teens, age 2-20
The Centers for Disease Control and Prevention (CDC) recommends BMI categorization for children and teens between age 2 and 20.
| Category | Percentile Range |
|---|---|
| Underweight | < 5% |
| Healthy weight | 5% - 85% |
| At risk of overweight | 85% - 95% |
| Overweight | > 95% |
BMI chart for children and teens, age 2-20
The Centers for Disease Control and Prevention (CDC) BMI-for-age percentiles growth charts.
Chart for boys Chart for girlsRisks associated with being overweight
Being overweight increases the risk of a number of serious diseases and health conditions. Below is a list of said risks, according to the Centers for Disease Control and Prevention (CDC):
- High blood pressure
- Higher levels of LDL cholesterol, which is widely considered "bad cholesterol," lower levels of HDL cholesterol, considered to be good cholesterol in moderation, and high levels of triglycerides
- Type II diabetes
- Coronary heart disease
- Stroke
- Gallbladder disease
- Osteoarthritis, a type of joint disease caused by breakdown of joint cartilage
- Sleep apnea and breathing problems
- Certain cancers (endometrial, breast, colon, kidney, gallbladder, liver)
- Low quality of life
- Mental illnesses such as clinical depression, anxiety, and others
- Body pains and difficulty with certain physical functions
- Generally, an increased risk of mortality compared to those with a healthy BMI
As can be seen from the list above, there are numerous negative, in some cases fatal, outcomes that may result from being overweight. Generally, a person should try to maintain a BMI below 25 kg/m2, but ideally should consult their doctor to determine whether or not they need to make any changes to their lifestyle in order to be healthier.
Risks associated with being underweight
Being underweight has its own associated risks, listed below:
- Malnutrition, vitamin deficiencies, anemia (lowered ability to carry blood vessels)
- Osteoporosis, a disease that causes bone weakness, increasing the risk of breaking a bone
- A decrease in immune function
- Growth and development issues, particularly in children and teenagers
- Possible reproductive issues for women due to hormonal imbalances that can disrupt the menstrual cycle. Underweight women also have a higher chance of miscarriage in the first trimester
- Potential complications as a result of surgery
- Generally, an increased risk of mortality compared to those with a healthy BMI
In certain cases, being underweight may signal an underlying health issue or condition, such as anorexia nervosa, which carries its own health risks. If you or someone you know appears underweight without a clear reason, it's important to consult a doctor for proper evaluation and guidance.
Limitations of BMI
While BMI is a commonly used and helpful tool for assessing healthy body weight, it has its limitations. It provides only an estimate and doesn’t account for differences in body composition. Given the diversity in body types and the varying distribution of muscle, bone, and fat, BMI should be evaluated alongside other measurements rather than relied upon as the only indicator of a person’s health or ideal weight..
In adults:
BMI isn’t a perfectly accurate measure because it reflects overall body weight rather than specifically measuring body fat. Various factors—such as age, gender, ethnicity, muscle mass, body fat percentage, and physical activity level—can all affect how BMI should be interpreted. For instance, an older adult with a “normal” BMI but a sedentary lifestyle may carry excess body fat, which is unhealthy, despite not being overweight. In contrast, a younger individual with the same BMI but more muscle mass would likely be considered healthy. Similarly, athletes—especially bodybuilders—may fall into the overweight category due to muscle weighing more than fat, even though their body composition is healthy. As the CDC explains:
- Older adults tend to have more body fat than younger adults with the same BMI.
- Women tend to have more body fat than men for an equivalent BMI.
- Muscular individuals and highly trained athletes may have higher BMIs due to large muscle mass.
In children and adolescents:
The limitations of BMI in adults also apply to children and adolescents. In younger individuals, factors like height and stage of sexual development can significantly impact BMI and body fat levels. BMI tends to be a more accurate indicator of excess body fat in obese children than in those who are simply overweight, as a higher BMI in overweight children may reflect either increased fat or fat-free mass (such as muscle, organs, and water). Similarly, lower BMI values in lean children may also result from variations in fat-free mass.
That being said, BMI is fairly indicative of body fat for 90-95% of the population, and can effectively be used along with other measures to help determine an individual's healthy body weight.
BMI formula
Below are the equations used for calculating BMI in the International System of Units (SI) and the US customary system (USC) using a 5'10", 160-pound individual as an example:
BMI Prime
BMI prime is the ratio of a person's measured BMI to the upper limit of BMI that is considered "normal," by institutions such as the WHO and the CDC. Though it may differ in some countries, such as those in Asia, this upper limit, which will be referred to as BMIupper is 25 kg/m2.
The BMI prime formula is:
Because BMI Prime is the ratio of two BMI values, it has no units—it’s a dimensionless number. A BMI Prime below 0.74 indicates underweight, between 0.74 and 1 falls within the normal range, values above 1 suggest overweight, and values exceeding 1.2 are classified as obese. The table below outlines weight classifications based on BMI Prime values:
| Classification | BMI | BMI Prime |
|---|---|---|
| Severe Thinness | < 16 | < 0.64 |
| Moderate Thinness | 16 - 17 | 0.64 - 0.68 |
| Mild Thinness | 17 - 18.5 | 0.68 - 0.74 |
| Normal | 18.5 - 25 | 0.74 - 1 |
| Overweight | 25 - 30 | 1 - 1.2 |
| Obese Class I | 30 - 35 | 1.2 - 1.4 |
| Obese Class II | 35 - 40 | 1.4 - 1.6 |
| Obese Class III | > 40 | < 1.6 |
BBMI Prime provides a quick way to assess how much an individual's BMI deviates from the upper boundary of the normal BMI range. It also enables comparisons across different populations that may have varying upper BMI thresholds.
Ponderal Index
The Ponderal Index (PI) is a metric similar to BMI, used to assess a person's body leanness or corpulence based on their height and weight. The key distinction is that PI uses the cube of height in its formula instead of the square, as with BMI (see formula below). While BMI is useful for analyzing trends in large groups, it may not accurately reflect an individual’s body composition. PI, though not without its limitations, tends to provide more accurate assessments for individuals who are exceptionally tall or short, where BMI can often misrepresent body fat levels. The formula below demonstrates how to calculate PI using USC units, illustrated with a 5'10", 160-pound example: